No-Code / Low-Code Development for Restaurants & Hospitality
No-Code Development for Restaurants & Hospitality
Restaurants and hospitality businesses operate in one of the most operationally complex environments of any industry — managing perishable inventory, coordinating multi-shift staff schedules, processing hundreds of daily transactions, maintaining vendor relationships, ensuring health and safety compliance, and delivering consistent guest experiences across every service period. Yet most restaurants manage these operations through a patchwork of paper systems, spreadsheets, and disconnected software tools that create manual workload, information gaps, and operational inconsistencies that directly impact profitability on already-thin margins.
4.9/5Verified rating
300+Clients served
23Products shipped
100+Case studies
Since 2015In production
28%
Food waste reduction with no-code inventory and waste tracking
33.2%→30.4%
Food cost percentage improvement across restaurant group
$134K
Annual savings from food cost and vendor optimization
6hrs→2hrs
Weekly scheduling time reduction per location manager
No-code development builds custom operational systems using platforms like Airtable, Zapier, Make, Softr, and Glide — creating the automation infrastructure a restaurant needs without the cost and complexity of custom software. A no-code solution can connect your POS data to automated inventory tracking, link staff scheduling to labor cost calculations, transform vendor ordering from phone calls and emails into streamlined digital workflows, and provide real-time operational dashboards that replace the end-of-day spreadsheet reviews that most managers rely on. The restaurant industry operates on 3-9% net margins, making operational efficiency a survival imperative rather than an optimization exercise. Every hour a manager spends manually reconciling inventory, every order placed late because the vendor communication process is cumbersome, every shift coverage gap that requires expensive last-minute staffing — these inefficiencies erode the thin margins that determine whether a restaurant thrives or merely survives. No-code automation addresses these inefficiencies at a fraction of the cost of enterprise restaurant management software, with faster implementation and greater flexibility to adapt as operations evolve. ZTABS builds no-code solutions for restaurants and hospitality businesses, creating automated operational systems that reduce manager workload, minimize waste and errors, improve staff coordination, and provide the real-time visibility that enables data-driven restaurant management.
Restaurant management is fundamentally a coordination challenge — coordinating perishable ingredients with menu demand, coordinating staff availability with service requirements, coordinating vendor deliveries with storage capacity, and coordinating guest expectations with operational capability. Each coordination failure has a direct financial cost: food waste from over-ordering, labor cost overruns from scheduling mistakes, service failures from ingredient stockouts, and revenue losses from understaffing during peak periods. Traditional restaurant management addresses these challenges through experience, intuition, and manual effort. Experienced managers develop a feel for how much to order, when to staff up, and which vendors need closer attention. But this experience-dependent approach doesn't scale — it breaks down when managers are absent, when new managers are learning, and when the business grows to multiple locations where a single manager's instincts can't cover every operation. No-code automation transforms experience-dependent management into systematic, data-driven operations.
Inventory decisions are based on actual consumption data rather than memory. Staffing decisions are informed by sales forecasting rather than gut feeling. Vendor management follows structured processes rather than varying by which manager is working. The automation creates operational consistency that doesn't depend on any individual manager's presence, knowledge, or workload capacity. The financial impact of operational automation for restaurants is significant because it addresses the three largest cost categories simultaneously: food cost (typically 28-35% of revenue), labor cost (typically 25-35% of revenue), and waste/error cost (typically 3-8% of revenue). A no-code system that reduces food waste by 10%, optimizes labor scheduling by 5%, and eliminates manual errors saves $50,000-$150,000 annually for a restaurant generating $2-5 million in revenue.
The Restaurants & Hospitality Market
The restaurant industry in the United States generates over $1 trillion annually through over 1 million establishments. The industry is characterized by high competition, thin margins, and significant operational complexity — making technology-driven efficiency improvement one of the few reliable paths to improved profitability. The technology landscape for restaurants includes POS systems (Toast, Square, Clover), reservation platforms (OpenTable, Resy), delivery integrations (DoorDash, Uber Eats), and accounting software (QuickBooks, Xero). These tools handle their specific functions well but don't communicate with each other — creating data silos and manual workflows that no-code integration addresses. The labor market for restaurant managers and staff remains challenging, with high turnover (the industry averages 75% annual turnover) and rising wages creating both cost pressure and knowledge-loss risk.
Operational systems that encode best practices into automated workflows reduce the impact of turnover — new staff can follow the system rather than learning through trial and error. Multi-unit restaurant groups face amplified operational challenges: maintaining consistency across locations, consolidating data for portfolio-level analysis, and standardizing processes while accommodating location-specific variations. No-code platforms scale naturally across locations, providing centralized management with location-specific customization. The food waste reduction imperative is both financial and environmental. Restaurants generate approximately 22-33 billion pounds of food waste annually in the U.S. Automated inventory tracking with waste monitoring not only saves money but supports the sustainability initiatives that increasingly influence consumer dining decisions.
How We Deliver No-Code / Low-Code Development for Restaurants & Hospitality
ZTABS builds no-code solutions for restaurants and hospitality businesses through a methodology that addresses the fast-paced, multi-stakeholder, and margin-sensitive nature of food service operations. We begin with an operational audit — observing service periods, documenting workflows, and analyzing POS and financial data — to identify the automation opportunities with the highest financial impact and operational feasibility. Our development covers the operational domains that drive restaurant profitability. Inventory and food cost management connects POS sales data to ingredient consumption tracking, providing real-time visibility into inventory levels, usage patterns, and cost metrics. Automated par level monitoring triggers reorder alerts when ingredients approach minimum levels. Waste logging captures reasons and quantities for waste events, enabling analysis of waste patterns and their causes. Weekly food cost reports are generated automatically from POS and purchasing data, replacing the manual calculations that most restaurants perform sporadically.
Vendor management and ordering streamlines the procurement process from a fragmented mix of phone calls, texts, and emails into organized digital workflows. Vendor catalogs with current pricing, order guides with par-level automation, order history tracking, and delivery confirmation logging create a procurement system that is consistent, auditable, and efficient. Staff scheduling and labor management integrates sales forecasting with scheduling tools to optimize labor deployment. Historical sales data by day-of-week and daypart informs staffing recommendations. Shift trade and coverage requests are managed through automated workflows rather than group text chains. Labor cost monitoring provides real-time visibility into labor-to-revenue ratios during each service period. Guest feedback and quality management captures and routes guest feedback from multiple channels (in-person comment cards, Google reviews, social media mentions, post-visit surveys) into a unified system that tracks patterns, assigns follow-up tasks, and measures improvement over time.
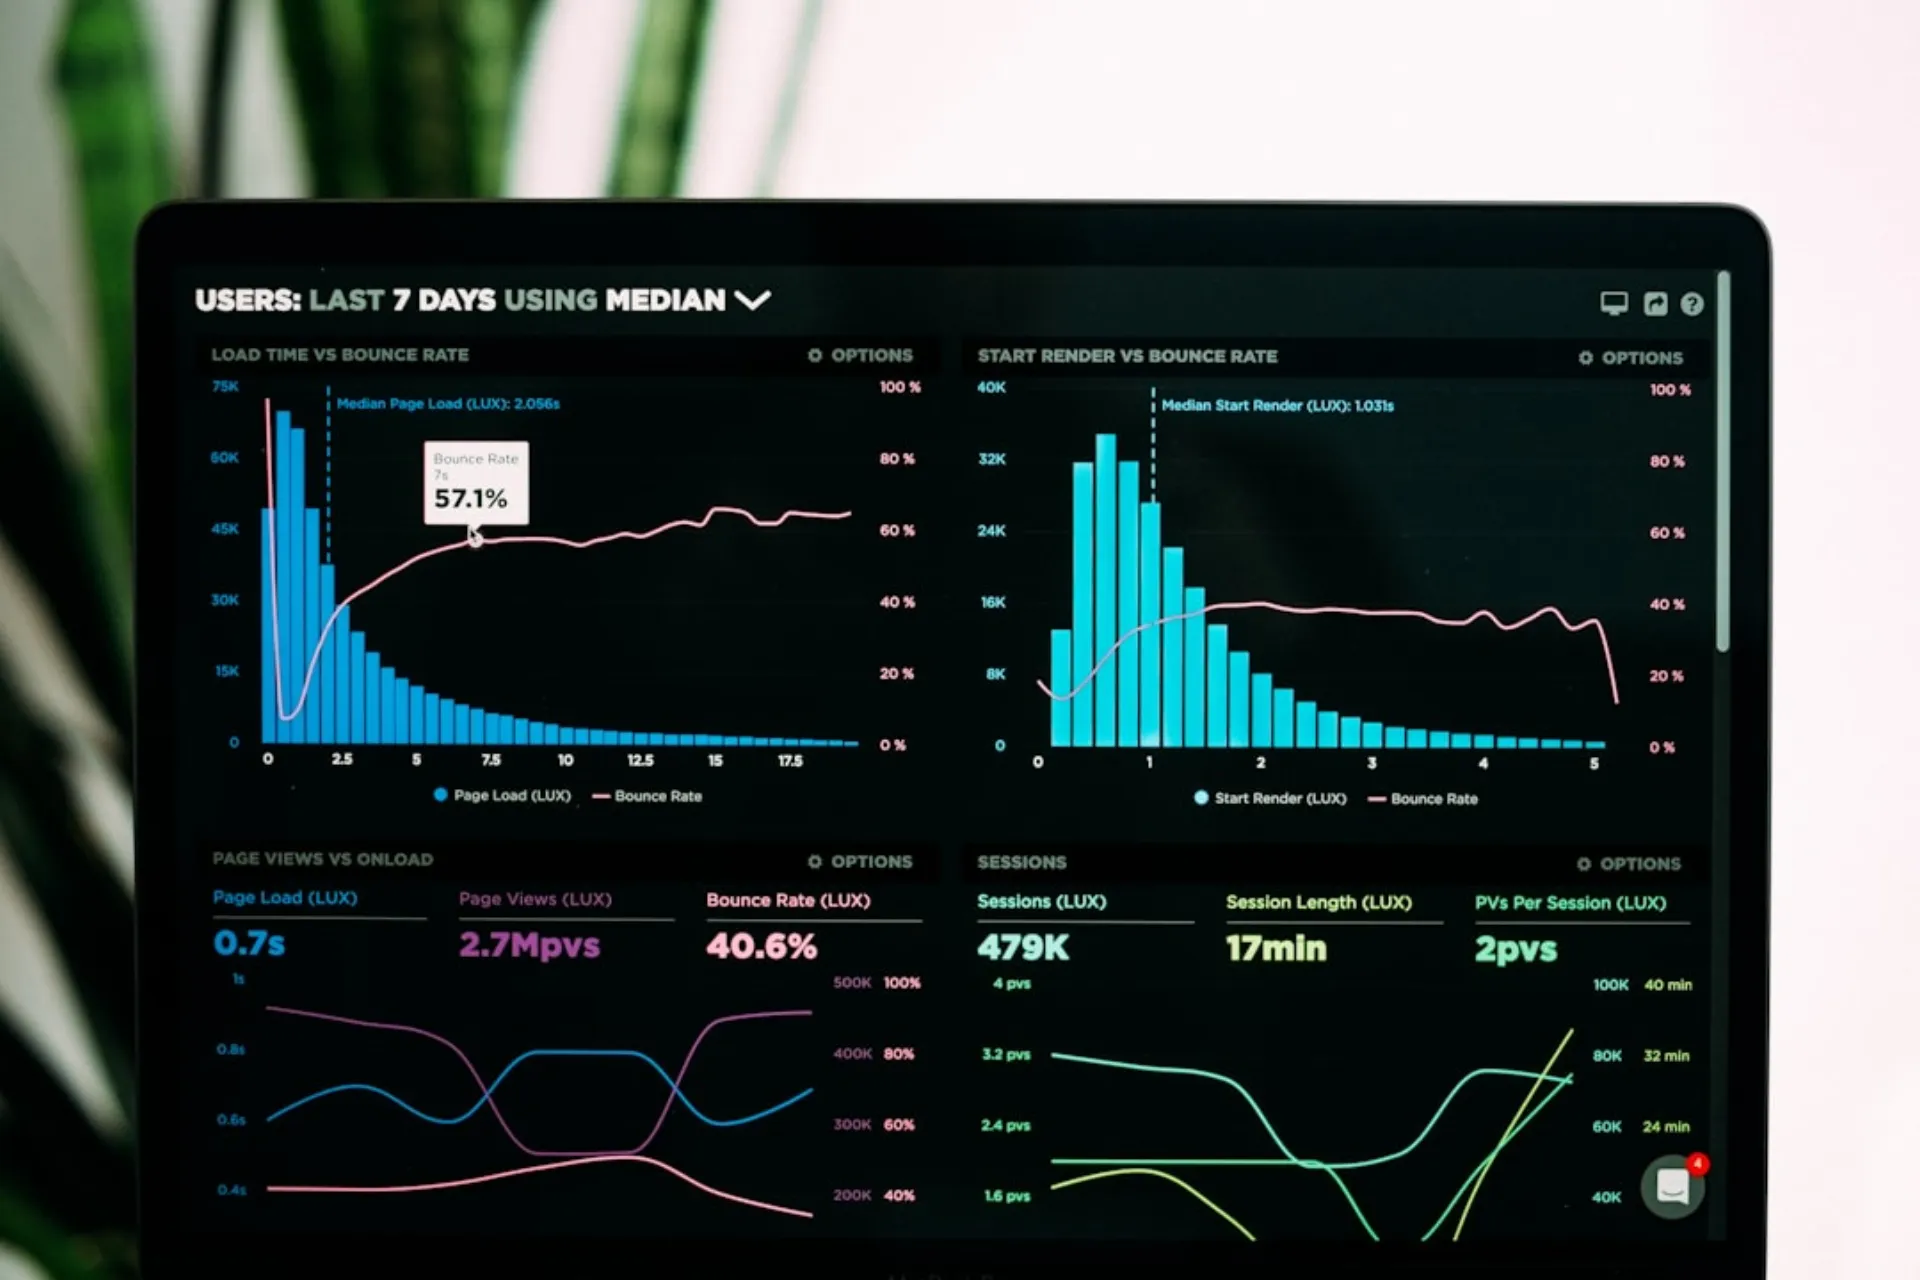
Management dashboards provide real-time and trending operational metrics: daily revenue and covers, food cost percentage, labor cost percentage, waste metrics, guest satisfaction scores, and location comparison for multi-unit operators. These dashboards replace the end-of-day or end-of-week spreadsheet analysis that most managers rely on.
Ready to discuss your no-code / low-code development project?
Free consultation — no commitment required.
Case StudyMulti-Location Restaurant Group
Restaurant Group Reduces Food Waste 28% and Saves $134K Annually with No-Code Operations Platform
The Challenge
A restaurant group operating 4 locations (2 full-service restaurants and 2 fast-casual concepts) generated $8.6 million in combined annual revenue. The group employed approximately 120 staff including 4 general managers, 8 kitchen managers, and over 100 front-of-house and back-of-house team members. Food cost averaged 33.2% of revenue — above the 30% target — representing approximately $180,000 in annual over-spending on food costs alone. The excess was attributed to inconsistent ordering practices, inadequate inventory monitoring, and food waste that was logged inconsistently if at all. Managers estimated waste but had no systematic tracking. Vendor management involved 22 active vendors across the 4 locations. Each location manager ordered independently through a combination of phone calls, text messages to sales representatives, and occasional online portals. No consolidated purchasing data existed — the group couldn't determine total spending by vendor, compare pricing across locations, or identify volume discount opportunities.
Staff scheduling consumed approximately 6 hours weekly per general manager (24 hours total across the group). Schedules were created in spreadsheets, distributed via group text, and modified through a constant stream of text messages for shift trades and coverage requests. Schedule adherence was difficult to enforce because the informal communication process made it unclear who was actually working which shifts. Operational reporting was a weekly ordeal: each general manager spent 3-4 hours compiling data from POS reports, invoice files, and staff records into spreadsheets for the ownership group. The reports were inconsistent in format and timing across locations, and the data was always at least a week old by the time decisions were made from it.
Our Solution
ZTABS built a no-code operations platform using Airtable as the central database, Zapier and Make for workflow automation, Softr for management dashboards, and integrations with the group's Toast POS system, QuickBooks accounting, and 7shifts scheduling platform. Inventory management system connected Toast POS sales data to ingredient-level consumption tracking. Each menu item was mapped to its recipe with ingredient quantities, and daily sales data automatically calculated theoretical ingredient consumption. Managers performed quick physical counts (15 minutes per section) and the system calculated variance between theoretical and actual consumption — highlighting areas of waste, over-portioning, or theft. Automated par level monitoring alerted kitchen managers when ingredients approached reorder points based on consumption velocity and lead times. Waste tracking provided a simple mobile interface (Glide app) where kitchen staff logged waste events: ingredient, quantity, reason (expired, prep error, over-production, customer return), and time.
The data fed into the Airtable database where weekly waste reports identified patterns — "Tuesday prep over-production of chicken accounts for 18% of protein waste" — enabling targeted operational corrections. Vendor management centralized ordering across all 4 locations. Each vendor's catalog was maintained in Airtable with current pricing, product specifications, and order history. Managers created orders from standardized order guides with suggested quantities based on par levels and upcoming reservations. Orders were sent to vendors through automated emails or portal submissions. Delivery receiving was logged in the system with quantity and quality checks, and invoices were matched to orders for variance detection. Consolidated vendor reporting showed total group spending by category and vendor, enabling purchasing negotiations informed by actual volume data. Staff scheduling integration connected 7shifts scheduling with Toast labor reports and Airtable operational data. Sales forecasting based on historical patterns suggested staffing levels by daypart and day-of-week.
Actual labor cost was calculated in real time during each service period, visible on management dashboards. Schedule change workflows were formalized through 7shifts rather than text messages, with approval routing and coverage tracking. Automated operational dashboards replaced the manual weekly reporting. Daily dashboards showed each location's revenue, covers, food cost percentage (calculated from POS and inventory data), labor cost percentage (from scheduling and sales data), and guest feedback summary. Weekly consolidated reports generated automatically for ownership review. Location comparison views highlighted performance variation across the group. Guest feedback aggregation collected reviews from Google, Yelp, and post-visit surveys into a single Airtable database. Each review was tagged by location, sentiment (positive/neutral/negative), and topic (food, service, ambiance, value). Negative reviews triggered automatic management alert tasks. Trending analysis showed whether feedback patterns were improving or declining by location and category.
The Results
Food waste decreased 28% within 6 months — driven by waste tracking visibility, consumption variance analysis, and par level optimization. The waste reduction translated to $78,000 in annual food cost savings across the 4 locations. Kitchen managers reported that simply making waste visible changed behavior — staff who knew waste was being measured wasted less. Food cost percentage decreased from 33.2% to 30.4% — approaching the 30% target — through the combination of waste reduction, vendor pricing optimization, and portion control improvements identified through consumption variance analysis. The 2.8-percentage-point improvement represented $240,000 in annual food cost reduction, of which $78,000 was attributed to waste reduction and $162,000 to purchasing optimization and portion accuracy improvements.
Vendor management consolidation identified $56,000 in annual savings through volume-based pricing negotiations (possible because the group could now demonstrate total volume across locations) and duplicate product elimination (3 locations were ordering similar items from different vendors at different prices). General manager scheduling time decreased from 6 hours to 2 hours weekly per location — a total saving of 16 hours weekly across the group. The labor forecasting integration reduced both overstaffing (wasted labor cost) and understaffing (service quality issues) by basing schedules on data rather than manager memory. Operational reporting time was eliminated entirely — automated dashboards replaced the 12-16 hours of manual report compilation that GMs had been spending weekly. Ownership received daily performance data rather than weekly stale reports, enabling faster operational decisions.
The total annual financial impact: $134,000 in combined food cost savings and vendor optimization, $52,000 in labor efficiency improvement (from schedule optimization and reduced management administrative time), and measurable improvement in guest satisfaction scores from more consistent operations — all built on no-code platforms with combined monthly costs under $600.
No-Code / Low-Code Development Capabilities for Restaurants & Hospitality
- ✓Bubble Web Apps
Full-featured web applications with user auth, databases, payments, APIs, and responsive design — built visually on Bubble with production-grade architecture.
- ✓Retool Internal Tools
Admin panels, dashboards, CRUD tools, and workflow apps that connect to your databases and APIs — built in days instead of months.
- ✓Webflow Marketing Sites
High-converting marketing websites and landing pages with CMS, animations, and SEO optimization — designer-quality without custom code.
- ✓Airtable Workflows
Data management, project tracking, CRM, and automation workflows built on Airtable with custom views, automations, and integrations.
- ✓Custom Integrations
Connect no-code platforms to your existing tools — APIs, databases, payment systems, CRMs, and marketing tools via native plugins or custom connectors.
- ✓Migration Path
We design no-code solutions with a clear migration path to custom development when you outgrow the platform — no vendor lock-in.
No-Code / Low-Code Development Landscape for Restaurants & Hospitality
Restaurants evaluating operational solutions encounter several categories. Restaurant management platforms (MarketMan, BlueCart, xtraCHEF) provide specific functions (inventory, purchasing, invoicing) but each addresses only one operational domain, and combining multiple platforms creates its own integration challenges. Enterprise restaurant management systems (Compeat, Restaurant365) provide comprehensive functionality but are priced for large groups and require significant implementation effort. Spreadsheet-based management (the current approach for most restaurants) is flexible but manual, error-prone, and not scalable. POS-native features (Toast reports, Square analytics) provide sales data but don't address inventory, scheduling, or vendor management automation. ZTABS differentiates through no-code systems that integrate across all operational domains — connecting POS data, inventory, vendors, scheduling, and reporting into a unified platform — at cost and implementation timelines accessible to independent and small-group restaurants.
No-Code / Low-Code Development Pricing for Restaurants & Hospitality
No-code development for restaurants and hospitality businesses typically ranges from $12,000 to $40,000 depending on location count, automation scope, and integration complexity. Single-location restaurants with inventory tracking, vendor management, and basic reporting typically invest $12,000 to $20,000. Multi-location groups (2-5 locations) with comprehensive automation, consolidated reporting, and advanced analytics typically invest $20,000 to $32,000. Large restaurant groups (5+ locations) with standardized workflows, enterprise reporting, and custom operational tools typically invest $32,000 to $40,000. Platform costs (Airtable, Zapier, Make, Softr) typically run $200-$500 monthly. POS integration setup is included in development scope. Ongoing optimization, workflow updates, and platform maintenance typically cost $400 to $1,000 monthly.
Frequently Asked Questions
Common questions about no-code / low-code development for restaurants & hospitality
We connect to your POS (Toast, Square, Clover) through its API to pull daily sales data. Each menu item is mapped to its recipe with ingredient quantities, and the system calculates how much of each ingredient was theoretically consumed based on what was sold. Comparing theoretical consumption to physical counts reveals waste, over-portioning, and other variances.
Ready for No-Code / Low-Code Development Built for
Restaurants & Hospitality?
Our team has deep expertise in restaurants & hospitality technology. Get a free consultation.
500+
Projects Delivered
4.9/5
Client Rating
90%
Repeat Clients