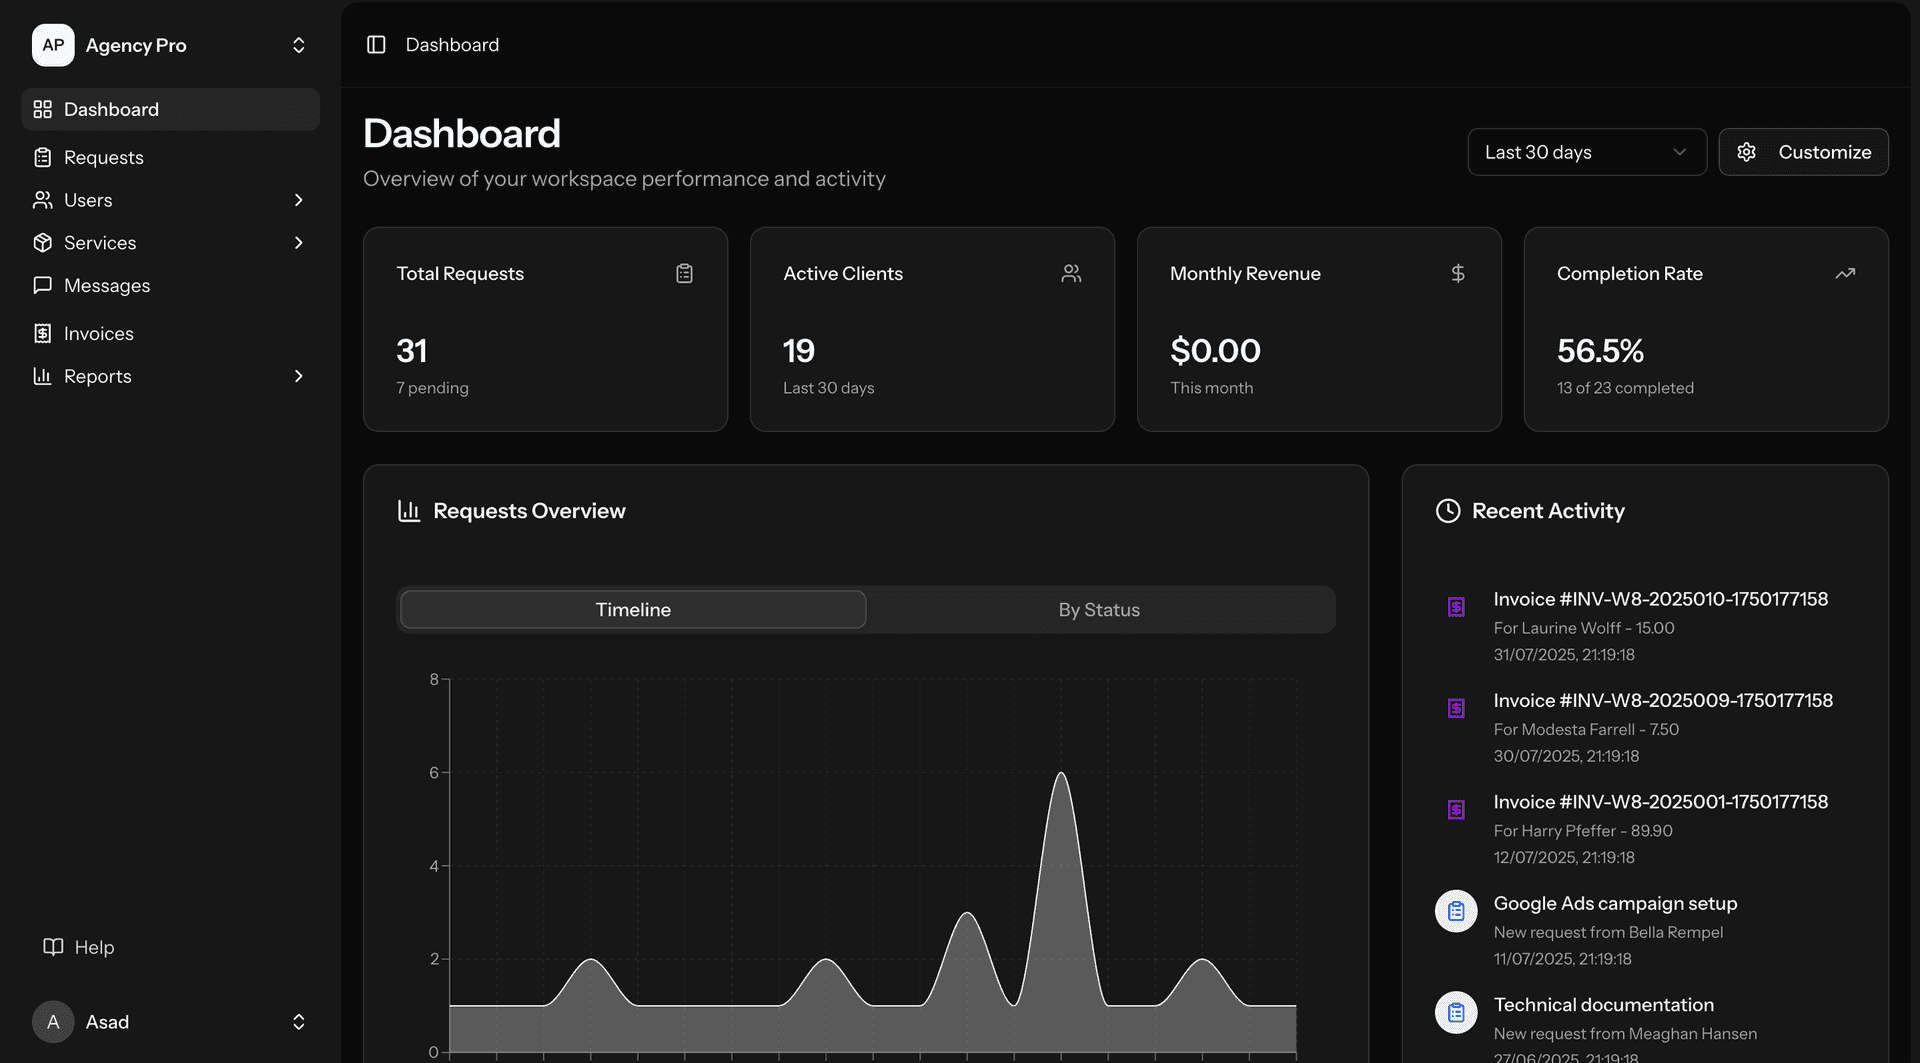
Our Hong Kong data analytics development follows a methodology designed for Hong Kong business speed: (1) Data assessment (weeks 1-2): understanding the data landscape. Data source inventory: cataloguing all data sources — databases (SQL Server, Oracle, PostgreSQL, MySQL), SaaS platforms (Salesforce, HubSpot, Shopify), files (Excel, CSV — still a primary data source in many Hong Kong organisations), APIs (third-party data feeds, market data, public data), and legacy systems (mainframe extracts, flat files, and proprietary formats). Data quality assessment: evaluating each source — completeness (what percentage of fields are populated?), accuracy (does the data match reality?), timeliness (how current is the data?), consistency (do related data sources agree?), and Chinese text handling (are Chinese characters stored correctly? Encoding issues — Big5 vs. UTF-8 — common in Hong Kong legacy systems). Analytics requirements: defining what the business needs to know — working backwards from decisions to data. Key questions: what decisions do you make? What information would improve those decisions? Where does that information come from? How quickly do you need it? Business stakeholders: defining requirements in business language — not technical specifications but business questions. (2) Data architecture (weeks 2-3): designing the analytics infrastructure. Data warehouse: centralised data repository for analytics. Cloud data warehouse (Snowflake, BigQuery, or Redshift — our recommendation for Hong Kong businesses. Cloud: eliminating infrastructure management, scaling with demand, and pay-per-query pricing aligning cost with usage). On-premises: for organisations with data residency requirements (some Hong Kong financial institutions preferring Hong Kong-hosted infrastructure). Data modelling: designing the data warehouse schema — dimensional modelling (star schema) for analytics performance. Hong Kong-specific: multi-currency handling (HKD, CNY, USD), bilingual dimension tables (product names, category names in both Chinese and English), and fiscal calendar alignment. ETL/ELT pipeline: data flowing from source systems into the data warehouse. ETL (Extract, Transform, Load — traditional approach, transforming data before loading), or ELT (Extract, Load, Transform — modern approach, loading raw data and transforming within the warehouse. Our preference: ELT with dbt for transformation — enabling data engineering best practices within the warehouse). Pipeline orchestration: Apache Airflow or Prefect for scheduling and monitoring data pipelines — automated data refreshes with alerting for failures. (3) Analytics development (weeks 3-6): building the analytics capability. Dashboard development: interactive dashboards providing self-service analytics. Tool selection: Metabase (open-source — our default for mid-market Hong Kong businesses), Tableau (enterprise analytics — strong for complex visualisation), Looker (Google-integrated — strong for data-driven organisations wanting governed self-service), or Power BI (Microsoft-ecosystem — strong for organisations already on Azure/Microsoft 365). Dashboard design: Hong Kong-specific considerations — bilingual labels and headers, HKD currency formatting, Chinese date formatting (年月日), and mobile-optimised layouts (Hong Kong executives frequently accessing dashboards from mobile). Executive dashboards: high-level KPIs with drill-down capability — revenue, profitability, customer metrics, and operational performance. Department dashboards: detailed analytics for specific functions — finance, sales, marketing, and operations. Self-service: enabling business users to explore data beyond pre-built dashboards — filtered views, ad-hoc queries, and custom report creation. Advanced analytics: beyond dashboards — predictive and prescriptive analytics. Predictive models (demand forecasting, customer churn prediction, and risk scoring — ML models trained on historical data to predict future outcomes), cohort analysis (customer cohort analysis — understanding how different customer groups behave over time. Hong Kong: cohort analysis by acquisition channel, customer segment, and product category), attribution modelling (marketing attribution — understanding which channels and campaigns drive conversions. Hong Kong: multi-touch attribution across Google, Facebook, WeChat, and offline channels), and anomaly detection (automated identification of unusual patterns — unexpected sales spikes, unusual transactions, and operational anomalies. Hong Kong financial services: anomaly detection critical for fraud and compliance). (4) Data quality and governance (weeks 5-7): ensuring analytics reliability. Data quality: implementing data quality checks throughout the pipeline. Source quality monitoring (tracking data quality at the source — alerting when source data quality degrades), transformation validation (testing data transformations — ensuring calculations are correct, joins produce expected results, and aggregations match source totals), and dashboard accuracy (reconciling dashboard numbers against source systems — ensuring executives see accurate data). Data governance: establishing data management practices. Data dictionary (documenting every metric — definition, calculation method, data source, and refresh frequency. Bilingual: definitions in English and Chinese for Hong Kong organisations), access control (role-based access to data and dashboards — ensuring users see only data appropriate to their role. PDPO compliance: personal data access restricted and audited), and data lineage (documenting how data flows from source to dashboard — enabling impact analysis when source systems change and providing transparency for data consumers). (5) Deployment and adoption (weeks 6-8+): making analytics part of business operations. Training: training business users to use analytics — dashboard navigation, self-service querying, and data interpretation. Hong Kong training: fast-paced, practical, focused on "how do I answer my business questions" rather than theoretical data concepts. Delivered in English or Chinese based on user preference. Adoption: driving analytics adoption — embedding dashboards into daily workflows (morning executive review, weekly team meetings, monthly business reviews), alerting (automated alerts when metrics exceed thresholds — sent via email, WhatsApp, or Teams), and data-driven culture (encouraging data-based decision-making — celebrating data-driven decisions and outcomes). Continuous improvement: analytics is never "done" — monthly review of dashboard usage, new dashboard requests, and data source additions. The analytics platform: evolving with the business — new metrics, new data sources, and new analytical capabilities added incrementally.