Data analytics in Seattle serves one of the most data-sophisticated markets in the world. Seattle's analytics ecosystem reflects a culture where data-driven decisions are expected. Clean energy companies need analytics for CETA compliance and renewable optimisation. Retailers compete against Amazon's analytical sophistication. Enterprises need modern data stacks consolidating data from dozens of operational systems. ZTABS builds data analytics platforms for Seattle companies, remote-first by design with an office in Houston, Texas.
Our AI development services and cloud services support Seattle's analytics infrastructure.
Seattle analytics at a glance
| Sector | Analytics need | Key requirement |
|---|
| Clean energy | Generation, grid, carbon tracking | Renewable, CETA, streaming |
| Retail | Customer, merchandising, supply chain | Omnichannel, seasonal |
| Enterprise | Unified data, self-service | Modern data stack, governance |
Clean energy analytics
Renewable generation forecasting using weather data and ML models to predict solar and wind output 1 to 72 hours ahead. Pacific Northwest's unique mix dominated by hydroelectric with growing wind and solar, requiring analytics modelling complex interactions between sources.
Battery storage optimisation for charge/discharge scheduling based on electricity prices, demand forecasts and degradation models. Pacific Northwest pricing patterns with cheap spring hydro and expensive late summer electricity.
Grid analytics for load forecasting at substation level, outage prediction from operational patterns and distributed energy resource management. Seattle metro's high EV adoption changing residential load patterns and creating grid management challenges.
Carbon tracking and reporting aggregating generation, consumption and emission data against CETA milestones. Following specific methodology requirements for compliance reporting.
Curtailment analysis identifying and quantifying renewable generation potential wasted because the grid could not absorb it. Transmission constraints, oversupply and ramp rate limits with economic cost calculation.
Retail analytics
Customer analytics unifying in-store, online and marketplace channels into single customer views. Behavioural segmentation, lifetime value prediction, purchase pattern analysis and churn risk identification.
Merchandising analytics optimising product assortment, pricing and promotion. Price elasticity testing, competitive positioning and promotion effectiveness measuring true incremental impact after accounting for cannibalization and forward-buying.
Supply chain analytics for demand forecasting at SKU-location level, inventory optimisation and logistics. Pacific Northwest geographic distribution requiring different strategies for urban Seattle versus rural Eastern Washington.
Seasonal Pacific Northwest patterns. Outdoor product demand following mountain and water sport seasons. Holiday demand compressed by Seattle's late-start shopping patterns.
Need data analytics for your Seattle company?
Share your data stack, analytical questions and compliance needs. We scope based on your specific requirements.
Enterprise data platforms
Modern data stack implementation replacing patchwork spreadsheets and aging BI tools. Cloud data warehouse (Snowflake, Databricks or BigQuery), dbt for transformation, Fivetran or Airbyte for ingestion and BI tools for visualisation.
Data governance implementing quality monitoring, role-based access controls, data catalogue and metric definitions. Single source of truth for business metrics, ensuring every dashboard uses the same calculation.
Self-service analytics enabling business users to explore governed datasets without SQL expertise. Pre-built dimensions and measures for ad-hoc analysis. Reducing analyst bottleneck while maintaining governance.
AI and ML analytics extending platforms from descriptive to predictive and prescriptive. Demand forecasting, churn prediction, anomaly detection and recommendation engines.
MHM compliance
My Health My Data Act applies to consumer health data with PHI-data exemptions where applicable. Not a blanket HIPAA-entity exemption for unrelated data. Collection requires specified-purpose consent OR the data is necessary for a requested service. Sharing requires separate consent OR is necessary for a requested service. SALE requires valid authorisation distinct from collection or sharing authorisation. Prohibited geofence uses around healthcare facilities apply. Consumer rights include access, deletion and withdrawal of consent.
Washington breach notice requires notification within 30 calendar days if relevant, not business days.
Industrial, port and EDI permissions, history and freshness apply with continuing hybrid EDI/API. No real-time versus EDI false choice. NWSA manages marine cargo operations, not every airport or cruise port operation. Boeing has regional and division facilities but corporate headquarters is not in Seattle; no inferred ZTABS client relationship.
Illustrative Example
Hypothetical: Seattle clean energy company implementing generation analytics
A Pacific Northwest clean energy company with wind and solar assets would implement a generation analytics platform over 10 to 14 weeks. The build would include: Snowflake warehouse with streaming ingestion from SCADA, weather services and energy market data. dbt transformation models for generation, demand, grid and financial domains. Renewable generation forecasting using weather data and historical performance. Battery storage optimisation for charge/discharge scheduling. Curtailment analysis identifying lost generation value. CETA carbon tracking dashboards for compliance reporting. Self-service analytics for engineering, operations and executive teams.
This is a hypothetical scenario for illustration. Actual scope, timeline and cost depend on your requirements.
Budget confirmed for your Seattle analytics project?
Share your data stack, growth stage and analytical requirements for a scoped estimate.
Data analytics platform cost and timeline
Published planning ranges for data analytics platform development from our cost guide:
| Tier | Range | Timeline | Scope |
|---|
| Basic Dashboard | $25K to $60K | 6 to 12 weeks | KPI dashboards, basic charts, data connectors, scheduled reports |
| Mid-Range Platform | $60K to $150K | 12 to 24 weeks | Multi-source pipeline, custom visualisations, drill-downs, alerting |
| Advanced Analytics | $150K to $200K | 24 to 36 weeks | Predictive analytics, ML-powered insights, real-time streaming, embedded |
| Enterprise | $200K to $250K+ | 8 to 14 months | Data warehouse, multi-tenant, self-service BI, NL queries, compliance |
These are published USD platform-build planning ranges with actual scope, not fixed local quotes or guaranteed delivery. Clean energy and enterprise implementations trend toward advanced and enterprise tiers due to streaming data, predictive modelling and multi-domain scope.
Separate mid-range vendor comparison assumes roughly 5 to 8 data sources, dbt-modelled BigQuery, Snowflake or ClickHouse warehouse with custom dashboards, drill-downs, alerting and export for US buyers in 2026. This benchmark is distinct from the four guide tiers above.
Analytics methodology for Seattle
Assessment and architecture. Data audit cataloguing existing sources, quality issues and capabilities. Architecture design for data volume, query patterns and user skill levels. Designing for current volumes and anticipated growth.
Data engineering. Pipeline development with warehouse setup, ingestion configuration and dbt transformation framework. Staging models cleaning raw data, intermediate models enriching across sources, mart models for analytical domains. Testing at every layer.
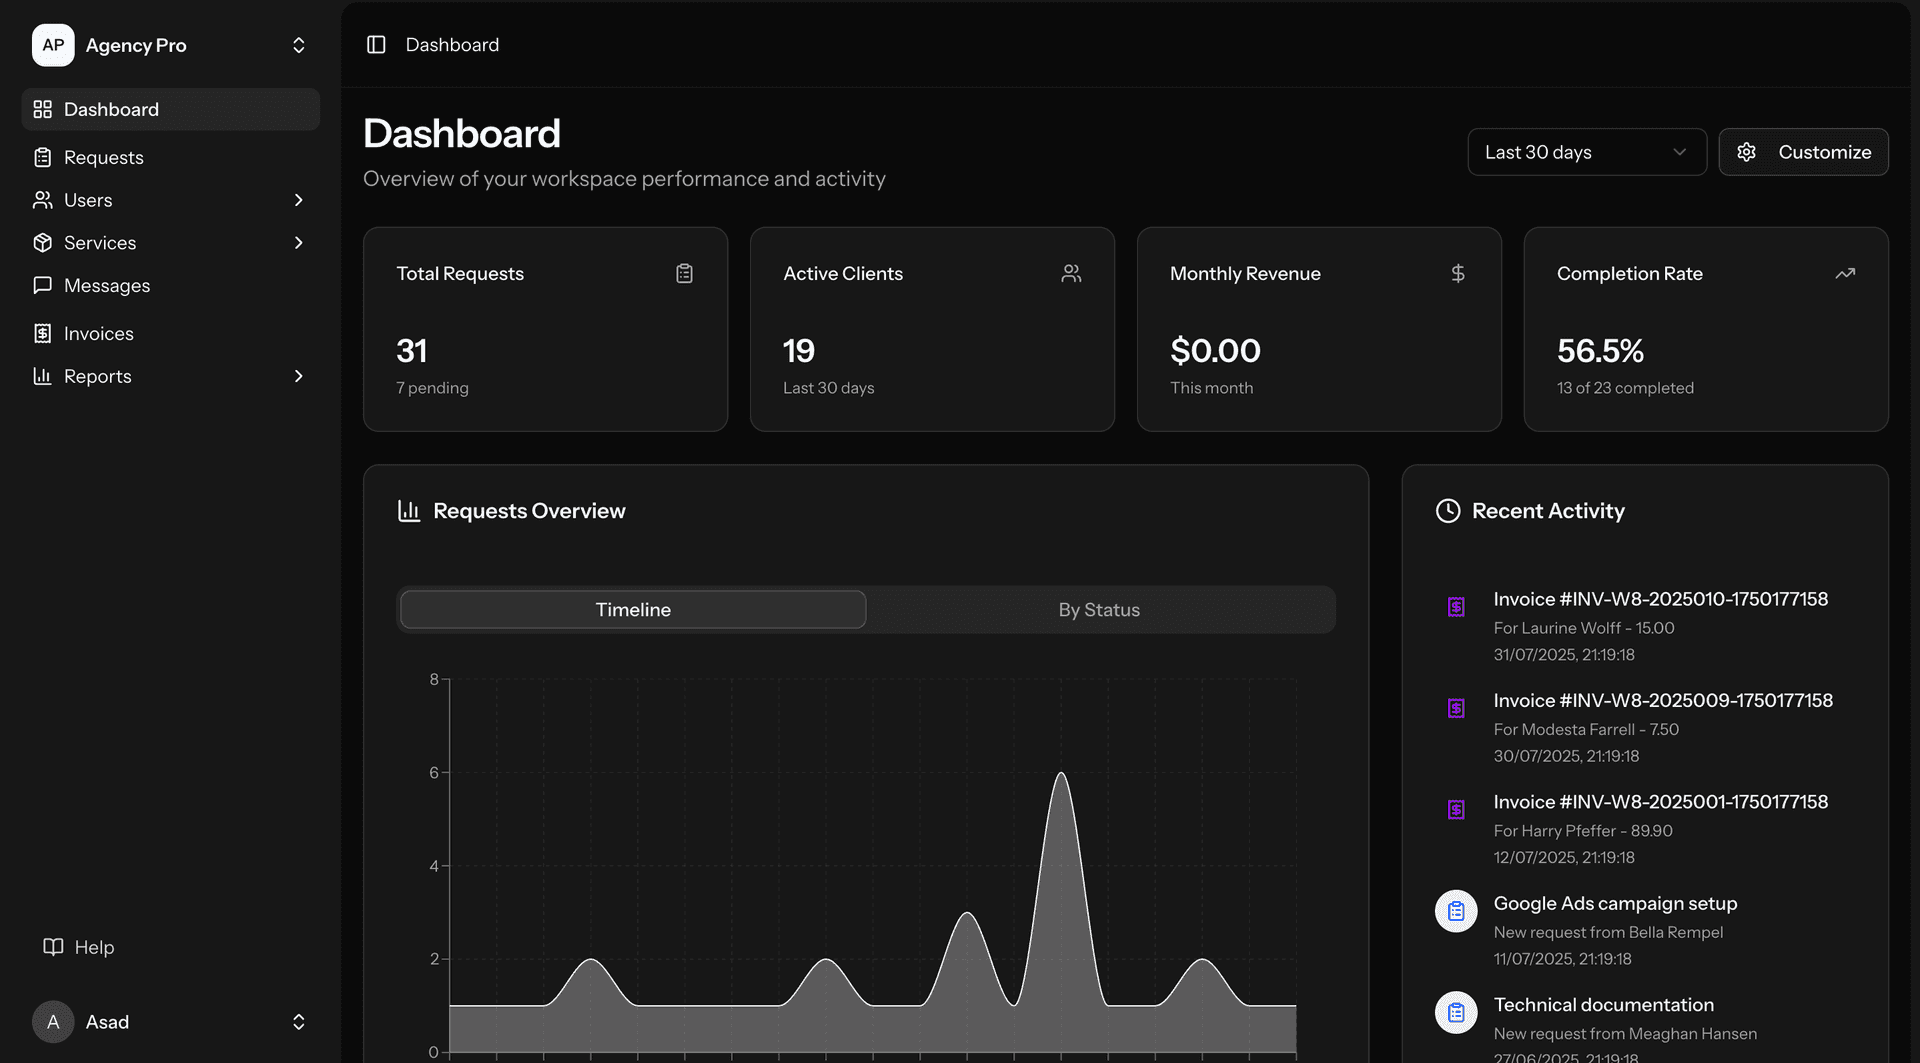
Dashboard and reporting. Executive dashboards with drill-down. Operational dashboards for real-time monitoring. Self-service exploration for governed datasets. Automated scheduled reports.
Data quality monitoring. Automated freshness, completeness and accuracy checks with alerts. Ongoing commitment as source systems change and data volumes grow.
Platform cost optimisation. Query optimisation, storage management and compute scaling. Cloud analytics costs growing with data volume require regular optimisation to ensure costs remain proportional to value.
Cloud IAM and tenant controls. Role-based access ensuring appropriate data visibility. Audit logging. Data quality with statistical uncertainty as measured objectives, not guaranteed perfection.
Additional analytics capabilities for Seattle
EV impact analysis. Modelling the impact of EV adoption on the distribution grid. Current penetration by service territory, projected growth, grid impact forecasting by location and time-of-day, and managed charging opportunity analysis.
Renewable generation performance monitoring. Detecting generation shortfalls indicating equipment issues. A solar panel producing below expected output may have a fault that can be corrected. Curtailment analysis quantifying economic cost of wasted generation.
Carbon tracking and CETA compliance. CETA obligations apply to electric utilities and retail electric suppliers, not every clean-energy company. Analytics aggregate generation emissions, market purchase emissions and renewable energy credit tracking against CETA milestones for covered entities. Year-over-year progress toward 2030 GHG-neutral and 2045 100-percent clean electricity targets.
Inventory optimisation. Balancing holding costs against stockout costs across retail supply chains. SKU-location level demand forecasting for purchasing and inventory planning.
Promotion effectiveness. Measuring true incremental impact of promotions after accounting for cannibalisation, forward-buying and margin impact. Distinguishing promotions driving new demand from those subsidising existing purchases.
Vendor performance analytics. Supplier scorecards tracking fill rate, lead time, quality and margin contribution. Informing sourcing decisions and vendor negotiations.
Data quality as code. Automated tests running on every pipeline execution. Quality metrics tracked over time. Catching data issues before they reach dashboards. Reconciliation against source systems.
ML model deployment and monitoring. Production-grade model deployment with automated retraining, accuracy monitoring and drift detection. A/B testing comparing model recommendations against baseline decisions.
Platform cost management. Cloud analytics costs scaling with data volume. Query optimisation, storage management and compute scaling ensuring costs remain proportional to value.
User training and adoption. Training matched to audience: executive dashboards requiring minimal training, self-service SQL exploration requiring more. Organisational change management for data-driven culture.
Metric layer and semantic definitions. dbt metrics or LookML ensuring key metrics defined once and used consistently. Revenue, cost, utilisation and conversion mean the same across all reports.
Exploratory analysis. Initial data investigation to understand quality, distribution, patterns and potential insights. Working with stakeholders to identify highest-value analytical questions before production build.
Customer lifetime value. For retail, calculating and modelling customer lifetime value across channels. Understanding acquisition, retention and expansion economics by segment and channel.
Subscription analytics. For Seattle's SaaS and subscription businesses, measuring MRR, churn, expansion and contraction. Connecting product usage to billing for revenue intelligence.
Smart meter analytics. Processing 15-minute interval readings from meters for demand analysis, pattern identification and load forecasting at granular geographic level.
Hydroelectric scheduling. Pacific Northwest hydroelectric analytics using snowpack data, river flow measurements and precipitation forecasts. Critical for spring runoff planning.
Retail price testing. Structured experimentation for pricing changes with proper control groups. Measuring demand elasticity at SKU and segment level.
Warehouse and distribution. Logistics analytics for Seattle's e-commerce distribution network. Route optimisation, carrier performance and delivery time prediction.
Marine and port analytics. NWSA manages marine cargo operations at Seattle and Tacoma terminals. Container throughput, vessel scheduling and yard utilisation analytics.
Environmental compliance. Washington state environmental regulations requiring emissions monitoring, waste tracking and remediation progress analytics for industrial and energy operations.
Real estate analytics. Seattle's housing market analytics for price forecasting, development feasibility and mortgage portfolio management. Neighbourhood-level trends and transit-oriented development analysis.
Gaming analytics. For Seattle's gaming industry, player engagement, session analytics, monetisation modelling and live operations dashboards for game publishers.
Fisheries and agriculture. Pacific Northwest salmon, timber and agricultural analytics connecting environmental monitoring with production and market data.
Aerospace analytics. Boeing's presence in the Puget Sound region creating demand for supply chain analytics, quality analytics and production planning. Defence and commercial aviation operations requiring analytical depth.
Healthcare analytics. For Seattle's health systems, patient flow, clinical quality and population health analytics. Value-based care transition requiring comprehensive outcome measurement.
Biotechnology analytics. For Seattle's biotech sector, clinical trial data management, research analytics and regulatory submission preparation. Connecting laboratory data with clinical outcomes.
Coffee and food supply chain. For Seattle's coffee industry, supply chain analytics tracking origin, quality, pricing and sustainability certifications. Connecting sourcing decisions with quality outcomes and consumer preferences.
Non-profit analytics. For Seattle's large philanthropic sector, programme outcome measurement, donor analytics and grant effectiveness tracking. Connecting funding with measurable community impact.
Cloud infrastructure analytics. For Seattle's cloud-native companies, infrastructure cost optimisation, service reliability metrics and capacity planning analytics. FinOps connecting cloud spending with business value delivery.
Risks in Seattle analytics
Data volume growth. Platforms must scale from current data volumes to anticipated growth. Architecture designed for 100GB that needs 10TB within two years requires different choices.
Tool sprawl. Multiple BI tools, databases and reporting environments create redundancy and inconsistency. Platform consolidation improves reliability.
MHM compliance. Health data analytics requires careful analysis of applicable scope and consent obligations.
Real-time versus batch. Not every analytical question requires real-time data. Matching freshness to actual decision cadence avoids unnecessary infrastructure cost.
How we deliver Seattle analytics
Discovery assesses existing data stack, analytical requirements, compliance needs and growth trajectory. For clean energy, discovery maps SCADA, weather, market and compliance systems. For retail, discovery maps POS, e-commerce, supply chain and customer systems. For enterprise, discovery maps all operational systems and existing BI tools.
ZTABS delivers from our Houston, Texas office, remote-first by design. Our DevOps services and AI development services support analytics infrastructure. ZTABS also builds custom white-label AI products that clients can brand and resell.
Choosing an analytics partner for Seattle
| Provider type | Strength | Tradeoff |
|---|
| ZTABS (remote-first, Houston office) | Full-stack analytics, energy/retail/enterprise | Remote-first by design |
| Cloud platform consultancy (AWS/Azure partner) | Strong infrastructure | Evaluate domain expertise and business analytics |
| BI implementation partner (Tableau, Looker) | Strong visualisation | Evaluate data pipeline and transformation depth |
| Data engineering boutique | Strong pipelines | Evaluate business domain and analytical capability |
When data analytics is not what you need
- You need utility operations software. Analytics analyses operational data; SCADA and EMS require specialised utility systems.
- You need retail POS. Analytics integrates with POS systems; POS implementation is a separate engagement.
- You need IT infrastructure. We build analytics platforms; network and server management requires IT services.
See our AI development services and cloud services for adjacent needs.
Ready to build your Seattle analytics platform?
Whether you need clean energy analytics, retail intelligence or an enterprise data platform, we scope based on your specific data and decisions.