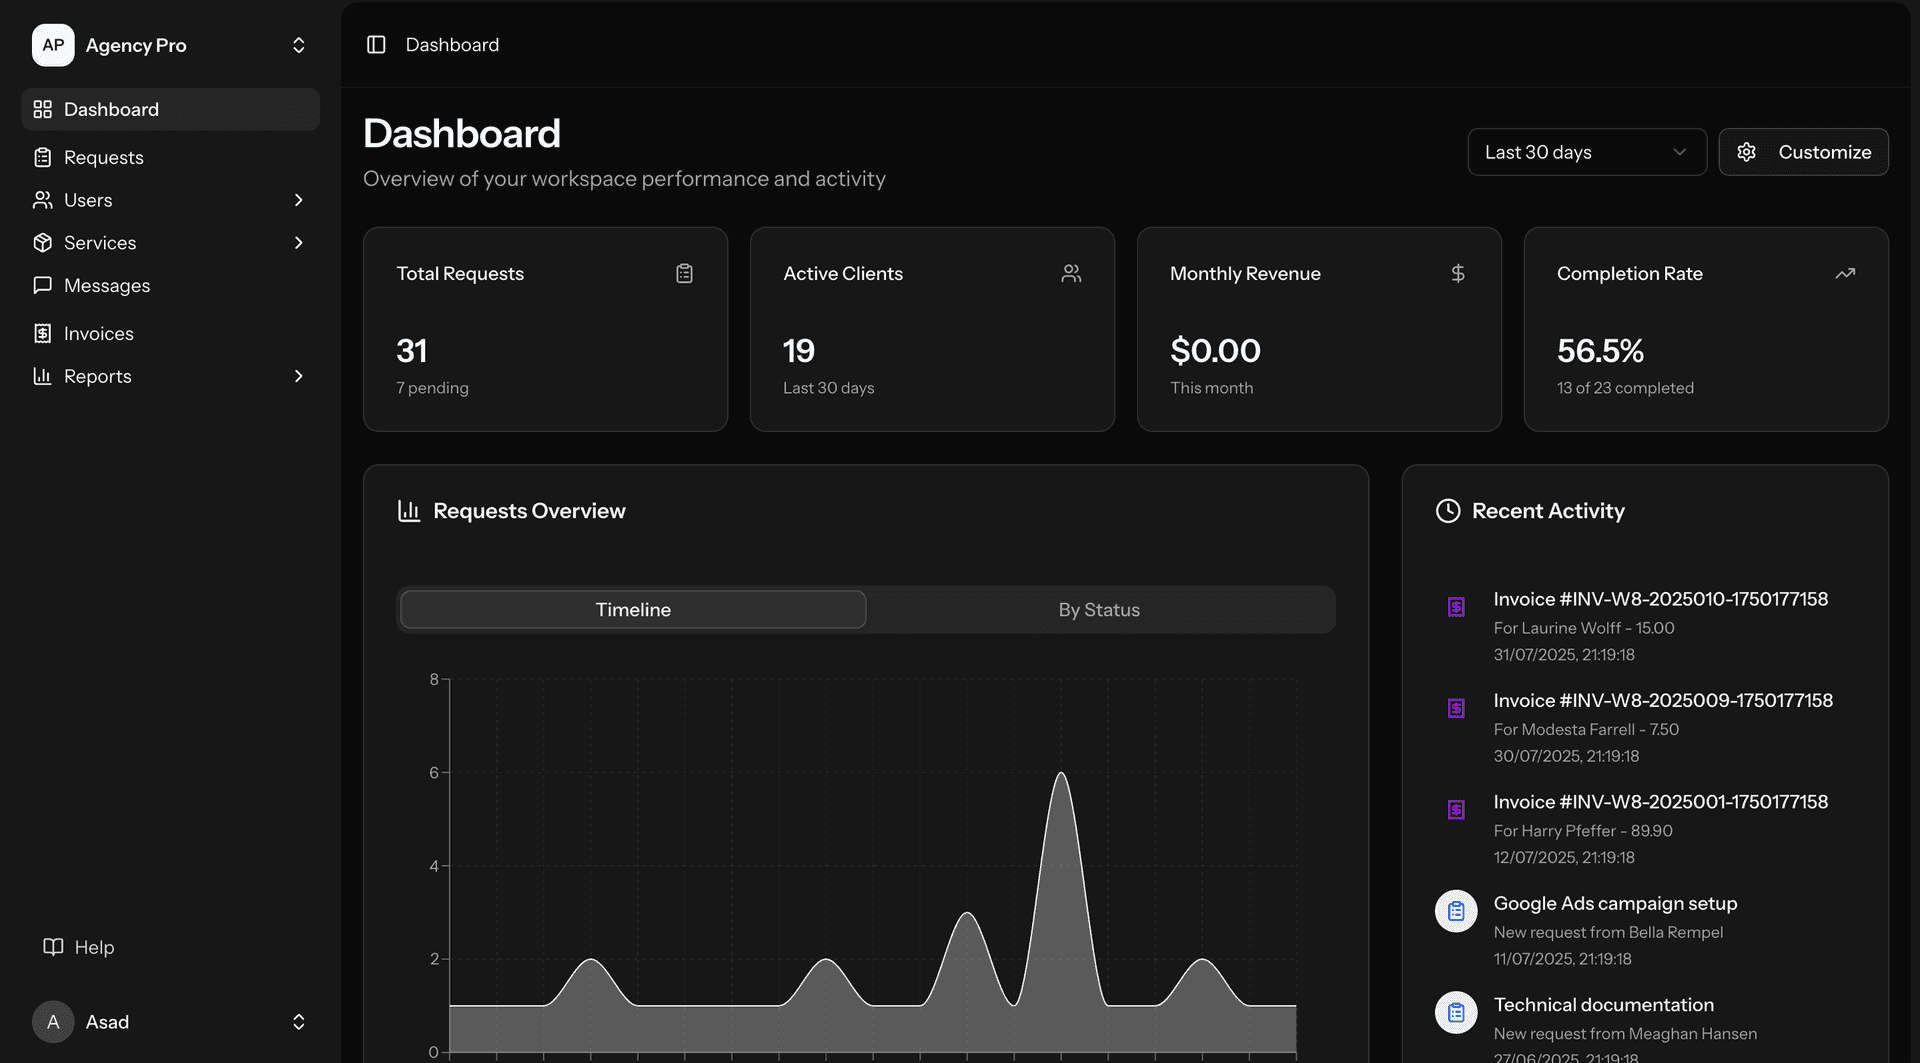
Our Melbourne data analytics projects follow: data assessment, architecture design, pipeline development, visualization, and enablement. Data assessment (weeks 1-2): understanding the data landscape. We inventory: data sources (every system that generates or stores relevant data — ERP, CRM, web analytics, marketing platforms, operational databases, spreadsheets, third-party data feeds), data quality (completeness — how many records have missing fields? Consistency — does the same entity have the same identifier across systems? Accuracy — do the numbers reconcile? Timeliness — how current is the data?), business questions (what does leadership actually want to know? We interview stakeholders across the organisation — CEO, CFO, marketing, operations, sales — to document the specific questions that data analytics should answer), and current analytics maturity (what reports exist today? How are they produced? How long does it take? How much do people trust them?). Data architecture (weeks 2-3): designing the analytics infrastructure. We recommend: modern data stack for most Melbourne businesses — comprising: data extraction (Fivetran or Airbyte — automated extraction from source systems, handling API changes, rate limiting, and incremental loading without custom code), data warehouse (BigQuery for Google-centric organisations, Snowflake for multi-cloud, Amazon Redshift for AWS-centric — all providing scalable, cost-effective columnar storage for analytical workloads), data transformation (dbt — SQL-based transformation framework, version-controlled, tested, documented — transforming raw extracted data into analysis-ready models), and data visualization (Looker, Metabase, or Power BI — depending on the organisation's ecosystem and user sophistication). For smaller organisations (under A$5M revenue, simpler data landscape): simplified stack — data extraction (custom Python scripts or Airbyte), data warehouse (PostgreSQL — sufficient for moderate data volumes), transformation (dbt or SQL views), and visualization (Metabase — open-source, self-hosted, lower cost). Pipeline development (weeks 3-6): building the data infrastructure. Data extraction: configuring connectors for each source system — Xero (financial data), Shopify/Magento (e-commerce), Google Analytics 4 (web behaviour), Google Ads and Meta Ads (marketing spend and performance), Salesforce/HubSpot (CRM), and custom databases (via database connectors). Each connector: configured for appropriate sync frequency (real-time for critical data, hourly for operational, daily for reporting) and incremental loading (extracting only new or changed records — not full table refreshes that waste resources). Data modelling: using dbt to build a layered data model — staging layer (raw data cleaned and standardised — consistent date formats, consistent naming, null handling), intermediate layer (business logic applied — customer lifetime value calculations, attribution modelling, cohort definitions, KPI calculations), and marts layer (analysis-ready tables optimised for specific use cases — marketing analytics mart, financial reporting mart, customer analytics mart). Each model: tested (dbt tests verifying data integrity — unique keys, not-null constraints, referential integrity, custom business rule validations) and documented (descriptions of each table and column — enabling self-service analytics for business users). Visualization (weeks 5-7): building dashboards that answer the documented business questions. Dashboard design principles: answer specific questions (each dashboard focused on a specific decision context — not a generic data dump), progressive disclosure (summary view showing key metrics → drill-down into details → filter by dimensions), appropriate chart types (line charts for trends, bar charts for comparisons, tables for detailed data — not pie charts for everything), and mobile-friendly (Melbourne executives checking dashboards on their phones — responsive layout with touch-friendly interaction). Standard dashboards we build: executive dashboard (revenue, costs, profit margin, YoY comparison, key KPIs — the 5-minute morning check), marketing dashboard (spend, leads, cost per lead, conversion rate, ROI by channel — the weekly marketing review), sales dashboard (pipeline, win rate, deal velocity, revenue forecast — the sales team daily view), operations dashboard (throughput, utilisation, quality, costs — the operations manager's control panel), and financial dashboard (P&L, cash flow, accounts receivable ageing, budget vs. actual — the CFO's monthly review). Enablement (weeks 7-8): ensuring the organisation can use and maintain the analytics infrastructure. Training: role-based (executives learn dashboard navigation, analysts learn data exploration, technical team learns pipeline maintenance). Documentation: data dictionary (every table, column, and metric documented), pipeline documentation (how data flows from source to dashboard), and runbook (troubleshooting common issues — pipeline failures, data discrepancies, dashboard errors). Self-service: enabling business users to create their own analyses — exploring data, building custom reports, and answering ad-hoc questions without requiring analyst support for every request.